Convert 360-degrees extended Field Of View scan to standard 180-degree
Visit the tomopy.sino_360_to_180 for more information.
Load HDF5 dataset of extended FOV scan
h5file = "/mnt/PETRA/SED/BEATS/IH/BEATS_first_scan-20230511T170626/BEATS_first_scan-20230511T170626.h5"
projs, flats, darks, theta = dxchange.read_aps_32id(h5file, exchange_rank=0, sino=(600, 800, 1))
print("Dataset size: ", projs[:, :, :].shape[:], " - dtype: ", projs.dtype)
print("Flat fields size: ", flats[:, :, :].shape[:])
print("Dark fields size: ", darks[:, :, :].shape[:])
print("Theta array size: ", theta.shape[:])
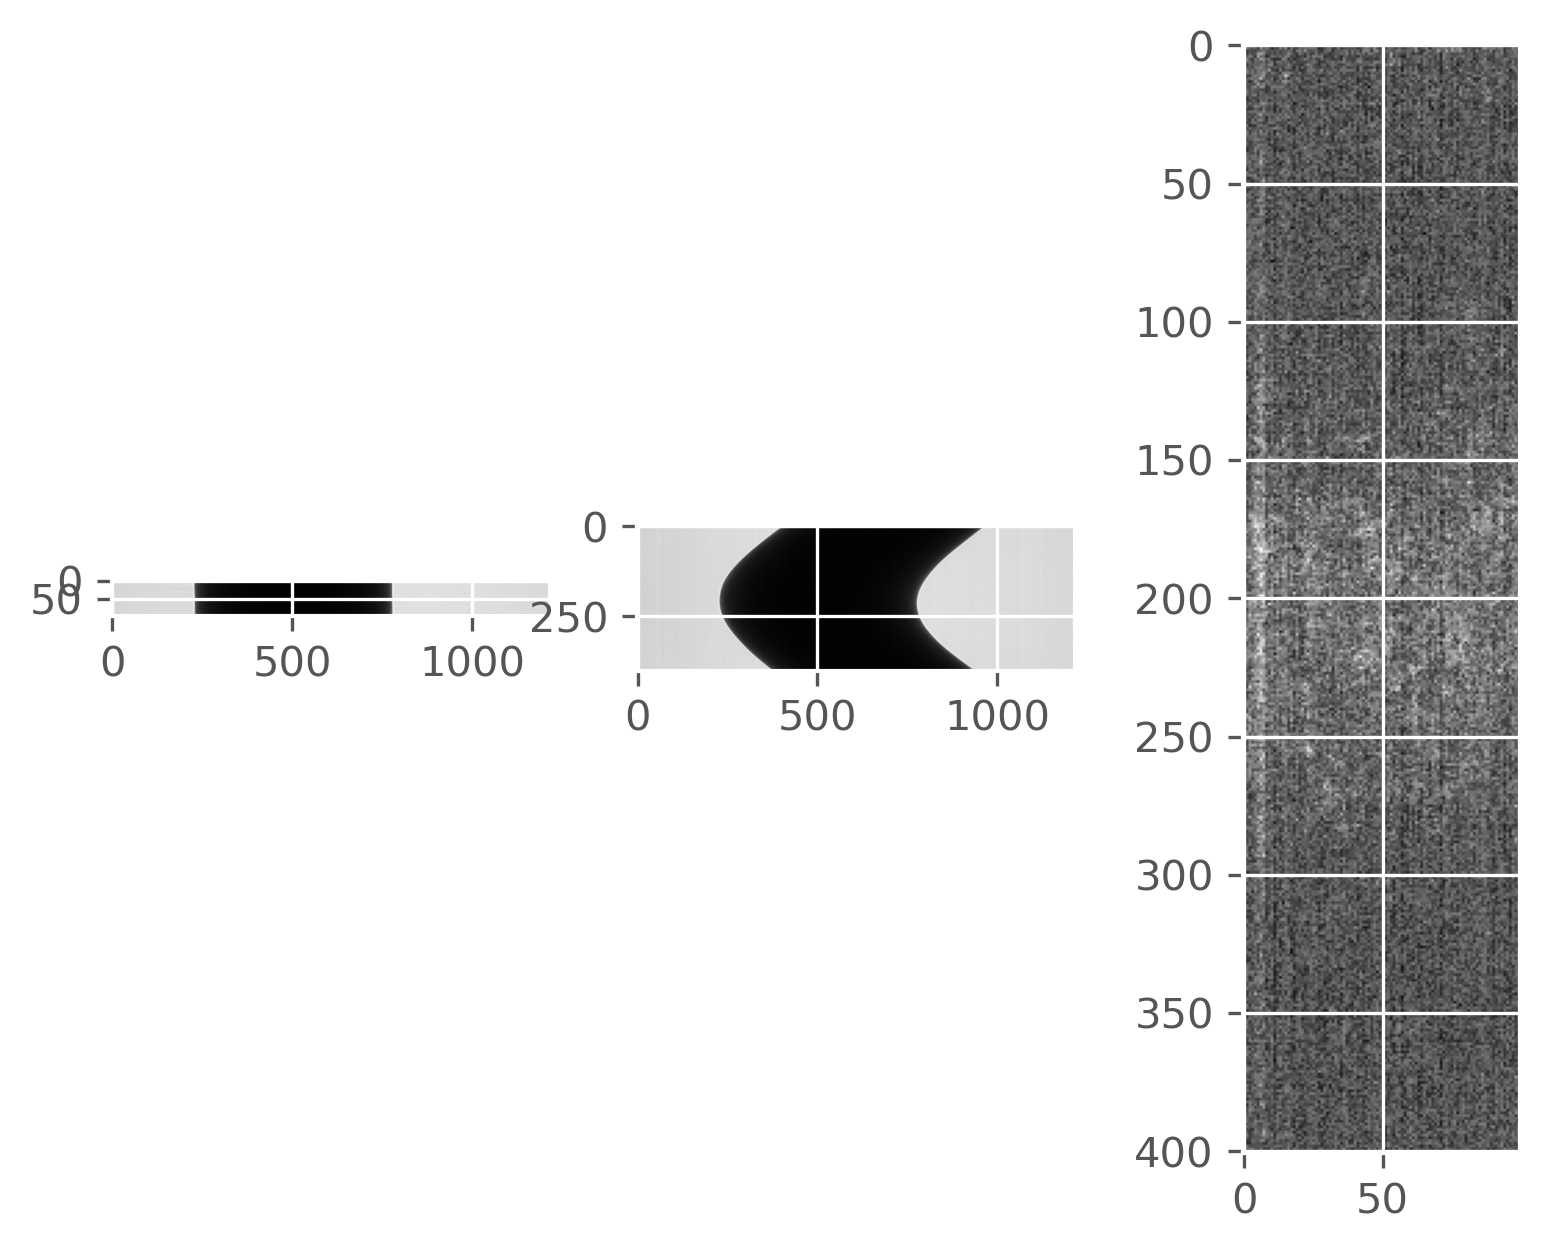
ru.plot_midplanes(projs)
projs_180 = tomopy.sino_360_to_180(projs, overlap=600)
Check for continuity of sinogram features.
Fine-tune the
overlapparameter.The correctly processed sinogram shows no edge but only continuous lines
plt.imshow(projs_180[600:900, 600, 2700:3300])
<matplotlib.image.AxesImage at 0x7fbfc88121d0>
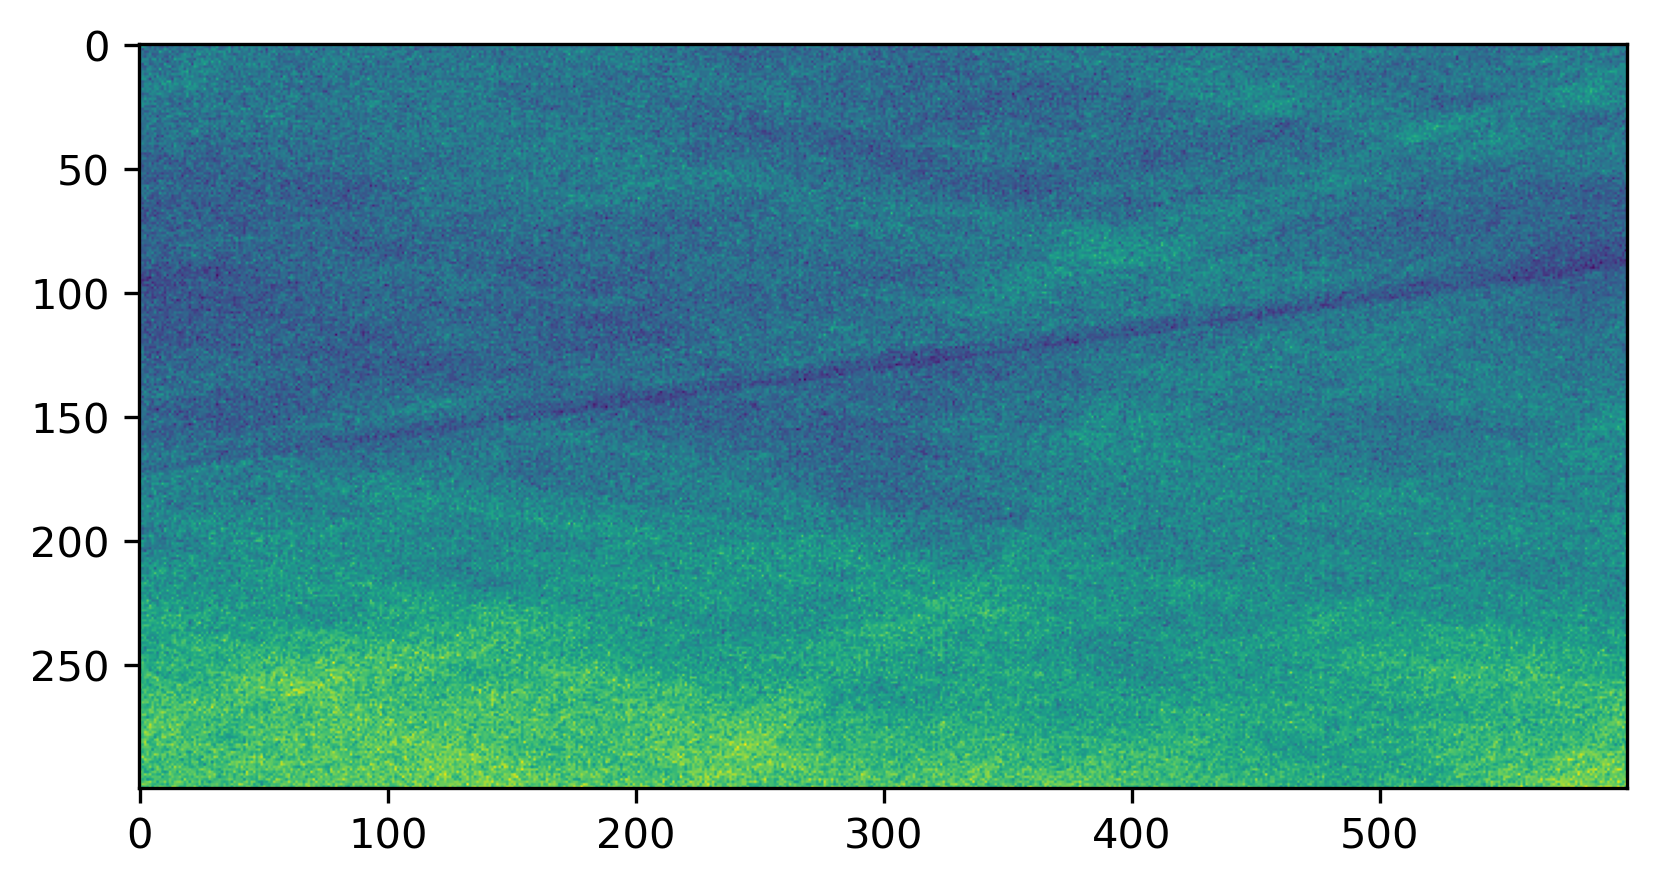
Sinogram processed with wrong overlap
projs_180 = tomopy.sino_360_to_180(projs, overlap=700)
plt.imshow(projs_180[600:900, 600, 2700:3300])
<matplotlib.image.AxesImage at 0x7fbfc88121d0>
Sinogram processed with correct overlap